 Make a Suggestion
Ask a Question
Print
Make a Suggestion
Ask a Question
Print Learner Assessment Report (Writing)
Key to numbers
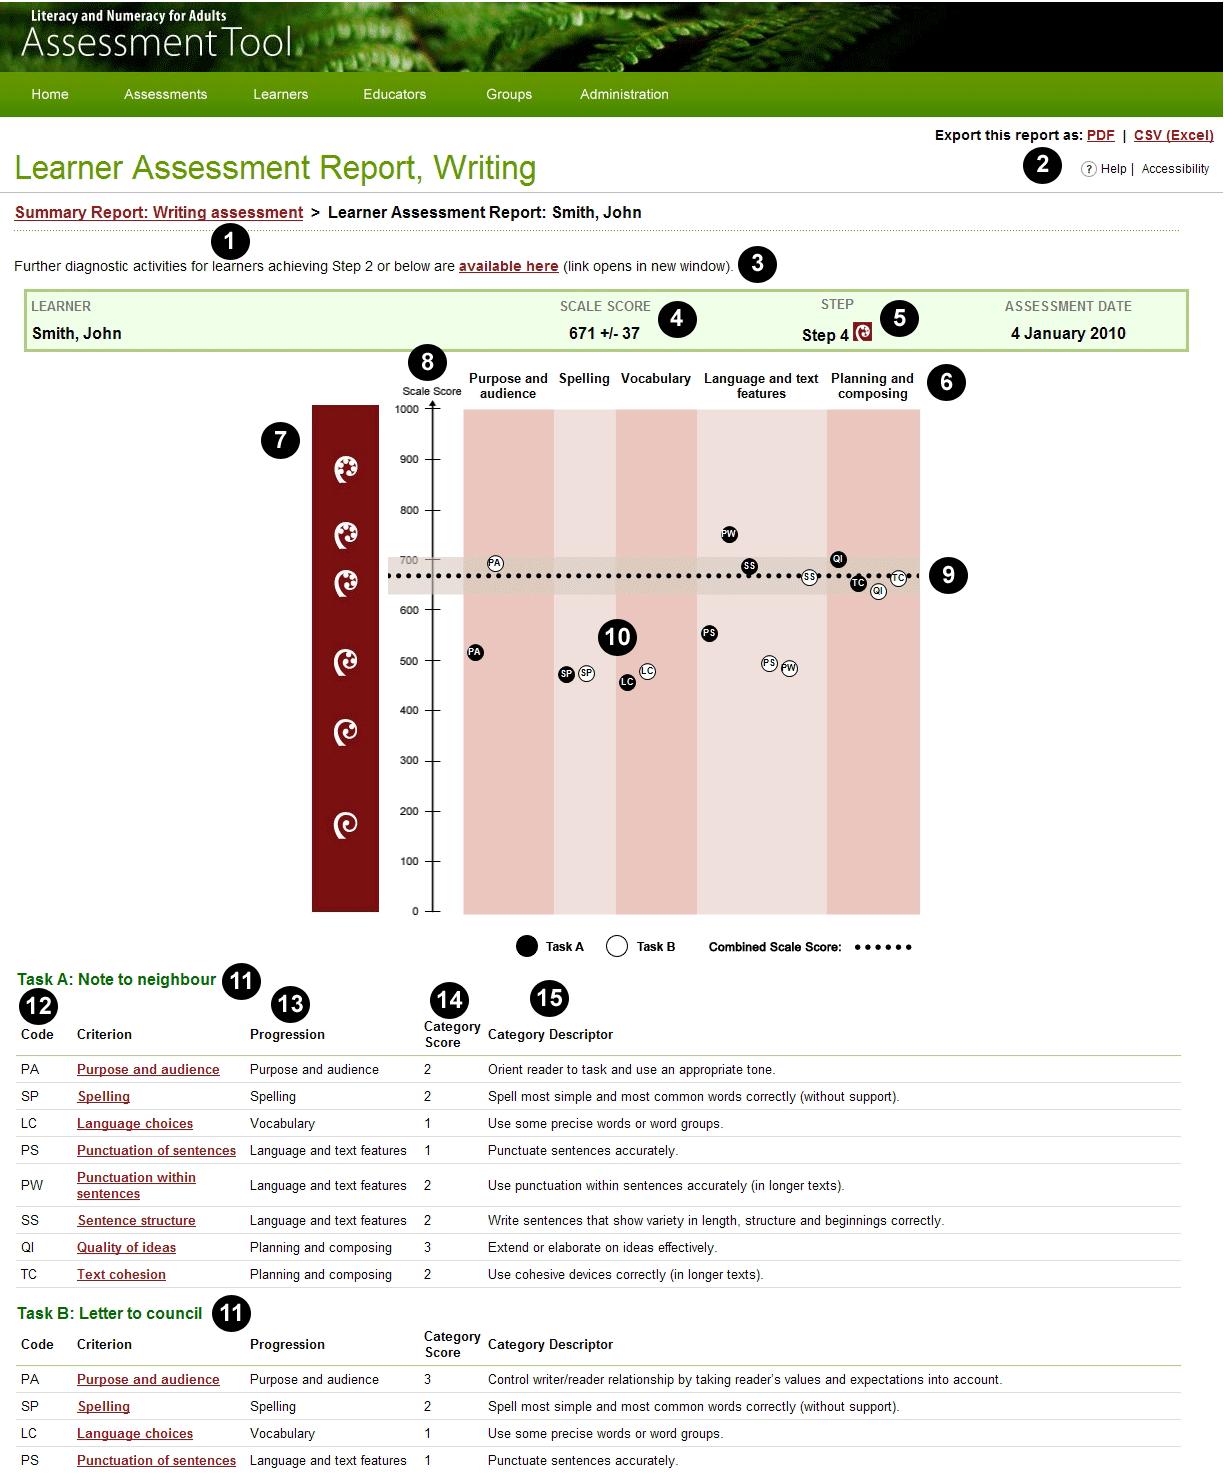
1. The name given to the Assessment.
2. Export this Report. You can download and keep a record of this Report as a PDF or CSV (Excel spreadsheet) by clicking on one of these links.
3. Link to diagnostic activities. Click on the link here for Writing Assessment activities that will help you to find out more about the strengths and weaknesses of Learners who are achieving at Step 2 or below on this Assessment.
4. Individual Learner's score on this Assessment. The Learner in this example (John Smith) has an estimated score of 671 ± 37, meaning that if he sat a similar Assessment he would probably score between 634 and 708.
5. The Learner's achievement on this Assessment in relation to the progression steps. This Learner achieved Step 4 on this Assessment.
6. Progressions assessed. The progressions 'Purpose and audience', 'Spelling', 'Vocabulary', 'Language and text features' and 'Planning and composing' were assessed. Criteria relating to each progression are in the shaded column below the progression name.
7. Koru. The koru indicate the steps on the learning progressions. There are six steps, with Step 1 at the bottom of the graph and Step 6 at the top.
8. The achievement scale, from 0 to 1000, showing increasing achievement on the learning progressions.
9. Individual Learner's estimated result on this Assessment. The dotted line shows this Learner's achievement on this test (671 on the scale, within the Step 4 range). The shaded band around the dotted line shows the range (671 plus or minus 37 scale score points = 634 to 708) within which this Learner would probably score if he took any similar test, given his current level of competence.
10. Criteria included in the Assessment, and the Learner's achievement on each criterion. Each criterion on which the Assessment was based is shown as a circle on the graph. There were two writing tasks in the Assessment:
- Black circle a criterion and level related to the first task, Task A
- White circle a criterion and level related to the second task, Task B.
The letters inside each circle indicate the criterion (see 12 below).
The position of the circle on the scale shows how difficult the category score achieved on the criterion is for most Learners who achieved the same score. Category scores shown higher up on the scale are more difficult to achieve; those shown lower down are easier.
11. Task title. There are two tasks in the Assessment, Task A and Task B. The name of each of the tasks is shown. In this example, Task A is called 'Note to neighbour' and Task B is called 'Letter to council'. Details about each task are listed separately, below the task titles.
12. Code and criterion (hyperlink). The first column shows the two-letter code for the criterion. This matches the code used in the circles on the graph (see 10 above).
The second column gives the full name of the criterion. For example, PA stands for Purpose and audience. Click on the criterion name to view more information about the task and about this criterion in relation to the task.
13. Progression. This column lists the learning progression that each criterion relates to. In some cases several criteria relate to one progression. For example, the criteria Punctuation of sentences, Punctuation within sentences, Sentence structure and Text cohesion relate to the progression Language and Text features.
14. Category score. This column shows the score the Educator gave to the Learner's writing on this criterion, using the marking guide for that task.
15. Category descriptor. This column relates to the category score (0, 1, 2 or 3) given by the Educator for this criterion. Each descriptor is a summary of the information in the marking guide for this score category.
More detailed information on the Reports in the Assessment Tool can be downloaded in PDF format here.
Make a Suggestion
Ask a Question
Print | Last reviewed:
14/04/2010 10:34:33 a.m. © Tertiary Education Commission. All rights reserved. |